Your Shopping Cart is empty.


Download sample
File Details
Published: 2025-01-23 19:53:07.542140 Category: Technology Type: Photo Model release: No
Share
       

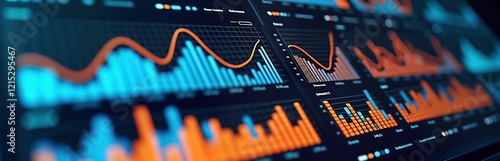
Colorful dashboard displays tech data analytics graphs, charts showing business, finance sector usage trends. Dynamic graphs show insights into tech usage, revenue growth. Dashboard represents tech

Contributor: Vadym
ID : 1215295467

TitleFilesize
Photo7168x2304


Buy on Adobe Stock

Keywords
dashboard, datum, graph, chart, business, finance, technology, sector, usage, revenue, growth, trend, colourful, interface, tech, corporate, success, management, leverage, feedback, improvement, partnership, adoption, number, network, software, computer, information, consumption, datum, graphic, chart, report, database, asset, connection, forecast, statistic, digital, modern, display, financial