Download sample
File Details
Published: 2022-08-10 18:15:24.392956 Category: Graphic Resources Type: Vector Model release: NoShare
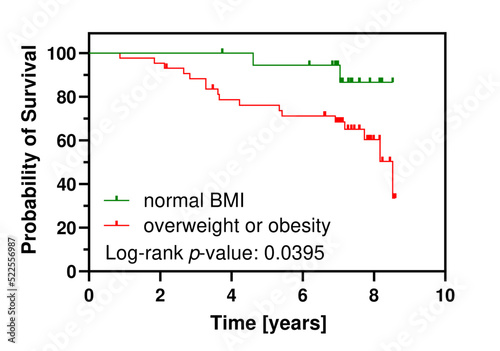
The Kaplan-Meier (KM) graph depicting survival in two groups of patients characterized by either normal or increased BMI. Results of statistical evaluation (log-rank test) of the model are depicted.
Contributor: Artur Wnorowski
ID : 522556987
 graph depicting survival in two groups of patients characterized by either normal or increased BMI. Results of statistical evaluation (log-rank test) of the model are depicted.'))
Keywords
graph, bmi, bmi, analysis, baseline, beta, calculation, chart, coefficient, concept, cox, datum, estimation, worked, hazard, hr, illustration, interpretation, limit, mathematical, methodology, model, modelling, plot, prediction, probability, product, ratio, regression, scaled, statistical, statistic, survival, variableRelated items
-

#526070457
-
#1625759879
-
#687416664
-
#119601878
-
#1838799314
-
#310792912
-
#1614326068
-
#858268722
-
#1614347372
-
#598618166
-
#1319674793
-
#470262993
-
#1396486768
-
#1855080037
-
#1174176976
-
#622461949
-
#574751603
-
#1342644671
-
#1556733988
-
#1800821732
-
#625394076
-
#213491185
-
#1843266985
-
#310787475
-
#75633826
-
#1851715428
-
#687416666
-
#1841199883
-
#470262990
-
#1843267274
-
#310787589
-
#858118260