Stock
Photo
Video
Audio
Vector
Collections
Packages
Lightboxes
Prints and Products
Wall Art
Canvas Prints
Framed Prints
Prints and Posters
Metal Prints
Acrylic Prints
Phone Cases
iPhone Cases
Galaxy Cases
Home Decor
Pillows
Duvet Covers
Shower Curtain
Clothes
T-Shirts
Souvenirs
Greeting Cards
Bags
Tote Bags
Categories
Site info
About
Support
Privacy Policy
FAQ
Contact Us
Google map
Shopping Cart
Member Area
English
Your Shopping Cart is empty.
Total:
View cart
Checkout
Search
Keywords:
Creator ID:
Type:
Photo
Illustration
Vector
Video
Template
3d
Categories:
Animals
Buildings and Architecture
Business
Drinks
The Environment
States of Mind
Food
Graphic Resources
Hobbies and Leisure
Industry
Landscapes
Lifestyle
People
Plants and Flowers
Culture and Religion
Science
Social Issues
Sports
Technology
Transport
Travel
News
Entertainment
Sport News
Languages:
Brazilan Portuguese - Brazil
English - Canada
French - Canada
Spanish - Mexico
English - United States
English - Belgium
French - Belgium
Dutch - Belgium
Czech - Czech Republic
English - Cyprus
Danish - Danmark
German - Germany
English - Estonia
Spanish - Spain
French - France
French - Marocco
English - Greece
English - Ireland
Italian - Italia
English - Latvia
English - Lithuania
German - Luxembourg
English - Luxembourg
French - Luxembourg
English - Hungary
English - Malta
Dutch - Nederlands
Bokmal Norwegian - Norway
German - Austria
Polish - Poland
Portuguese - Portugal
English - Romania
German - Switzerland
English - Slovenia
Slovakian - Slovakia
French - Switzerland
English - Finland
Swedish- Sweden
Italian - Switzerland
English - United Kingdom
English - Bulgaria
English - Australia
Japanese - Japan
Korean - South Korea
English - New Zealand
Russian - Russia
English - Ukrain
English - Thailand
Orientation:
All
Horizontal
Vertical
square
Color:
Model property release:
All
Yes
No
Duration Video:
All
Up to 10 seconds
Up to 20 seconds
Longer than 30 seconds
Results
(0)
Site
Getty/iStock
Shutterstock
Fotolia
Depositphotos
123rf
Bigstockphoto
Pixabay
Adobe Stock
Relevance
New
Most popular
Most downloaded
Undiscovered
12
24
36
48
96
Auto paging
Menu
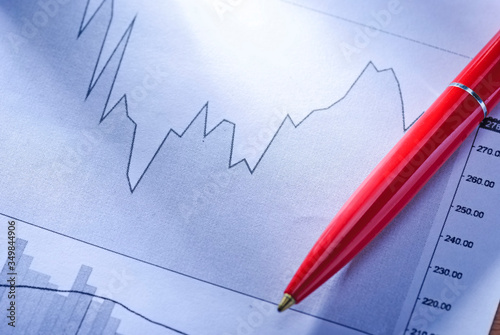
Ballpoint pen on a fluctuating statistical graph
Line and bar graph showing fluctuating business growth, accompanied by shopping bags and a commerce tag. Ideal for business analytics, market trends, e-commerce insights, retail analysis, sales
Close-up view of an advanced financial analysis interface with dynamic charts and fluctuating data points, showcasing market trends.
Dynamic 3D graph illustrating fluctuating market trends, showcasing growth and decline patterns over time.
A visual representation of mood tracking through emojis aligned with fluctuating graphs, ideal for UX design, data storytelling, or behavioral research.
Laptops showing fluctuating stock trends
3D render of fluctuating financial chart with arrows pointing up and down in mountain shape – Ideal for financial analysis, investment strategies, or market trend visuals.
A close-up of a digital screen, where a ticker of stock market news flashed, accompanied by intricate charts illustrating fluctuating interest rates, trade wars, and market volatility
Dynamic financial chart with fluctuating graphs and glowing elements on a blue background. Glowing Abstract Patterns. Illustration
Healthcare Costs premium concept. Abstract digital graphic of fluctuating data trends.
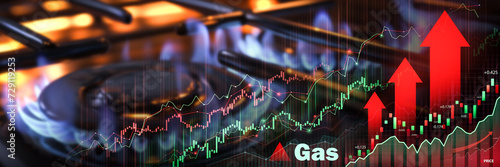
Gas burners with superimposed rising financial graphs, symbolizing the fluctuating energy market costs
stock market display shows strong performance with fluctuating graphs and vibrant colors